Power BI & Data Visualization
We build Power BI dashboards and reports that consolidate data and deliver consistent metrics across the business.

Data That’s Hard to Use
Data is being captured across your core systems, but it’s difficult to work with. Your reporting often depends on manual exports and spreadsheets, with data spread across multiple sources.
Analysts spend time combining and reconciling data instead of analyzing it. Reports are slow to update, inconsistent, and hard to trust.
Analytical dashboards can solve this, but only when the underlying data is structured correctly. Without a well-defined data model, dashboards become one-off reports rather than a reliable way to understand the business.
Dashboards That Drive Decisions
Executive Dashboards
Interactive executive dashboards with KPIs, trends, and variance analysis for management reporting.
Operational Reporting
Drill-down reports for department leads who need granular insight.
Financial Reporting
Financial reporting including P&L, cash flow, and budget-to-actuals, with paginated reports for formatted output.
Always Up-to-Date, Reliable Reports
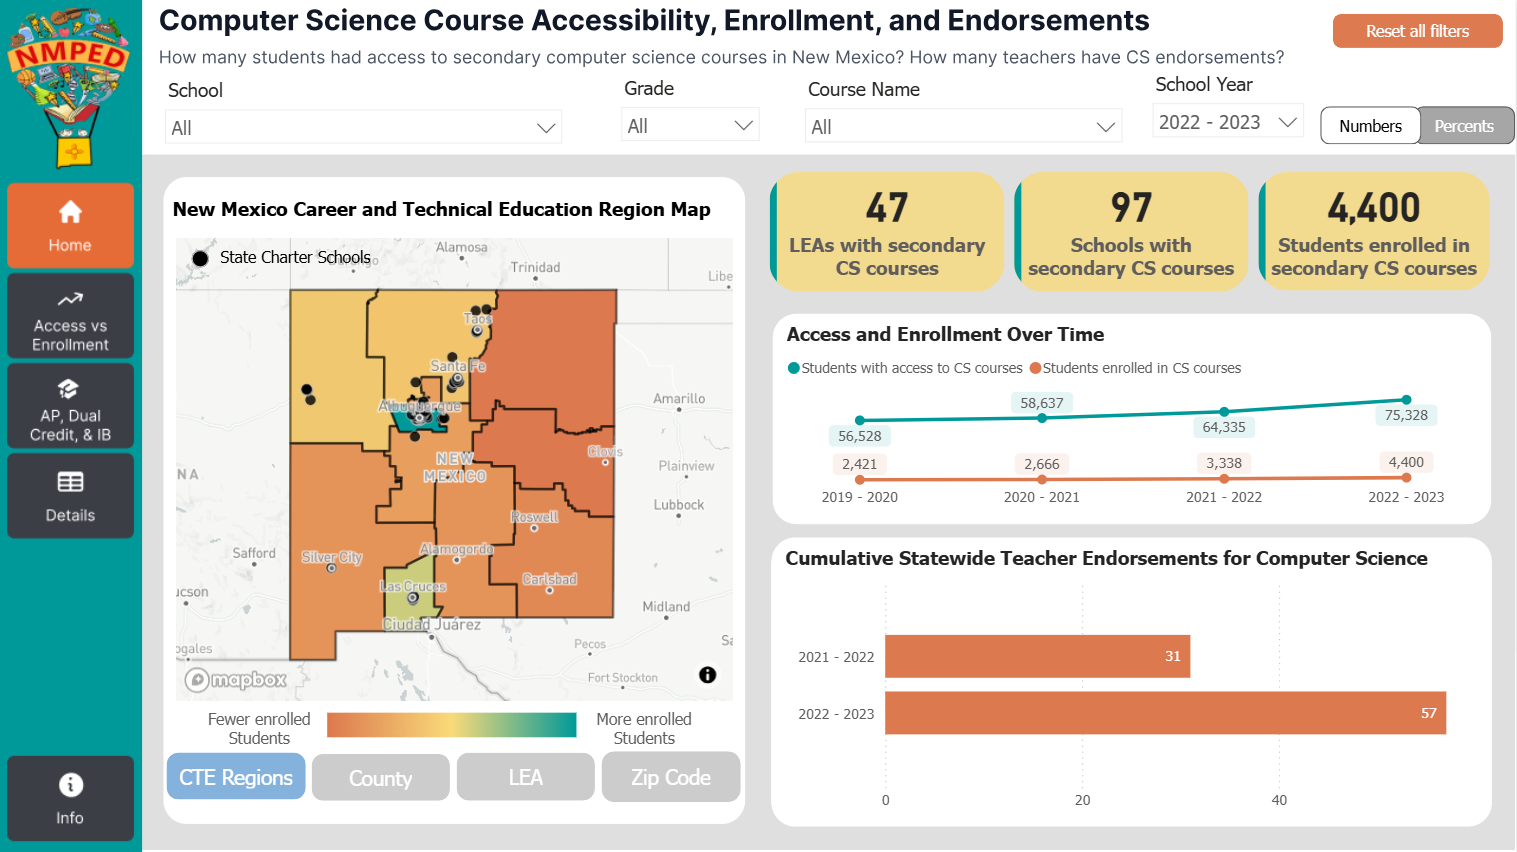
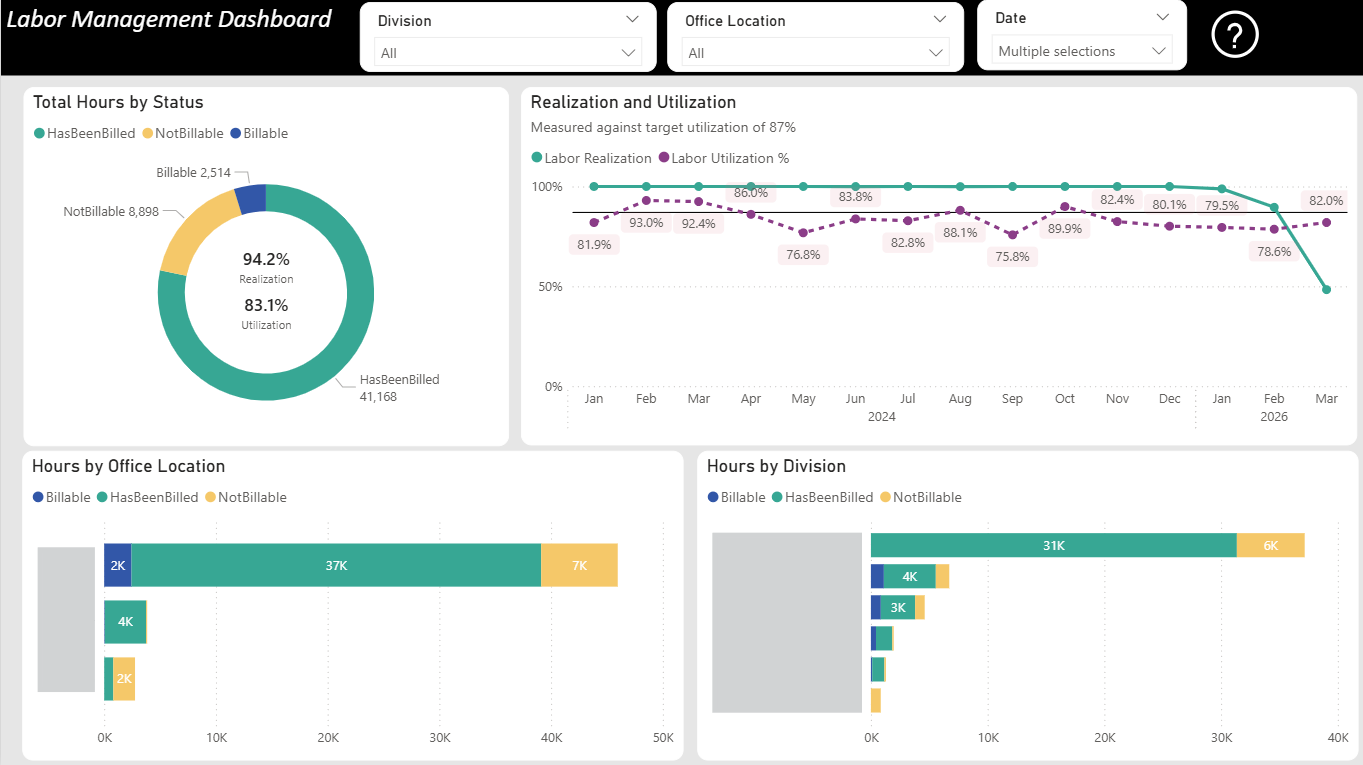
- Direct access to metrics. Dashboards provide immediate access to key metrics, eliminating the need for manual report requests.
- Less time defining requirements. Dashboards are built with our deep understanding of business and reporting, reducing the need for detailed specifications and repeated revisions.
- Consistent reporting across the organization. A shared semantic model defines metrics once and supports both standardized reporting and ad-hoc analysis.
What teams keep running into
Dashboards that aren't used
Built without a clear understanding of the business, dashboards may look polished but don't answer the questions users are asking.
Ad-hoc requests take too long
Answering simple questions requires pulling data from multiple systems and building one-off reports.
Conflicting metrics across teams
Different departments report different numbers for the same metric, with no shared definitions or reporting layer.